Get expert real estate advice in your inbox
Oakley Signs & Graphics
My Cart ({{ cartcount }} items)
SUBTOTAL
{{ carttotal.original | currency }}{{ carttotal.subtotal | currency}}
{{ alertSuccess }}
{{ alertInfo }}
{{ alertWarning }}
{{ alertDanger }}

What is Local Logic?

Neighborhood Reports from Local Logic

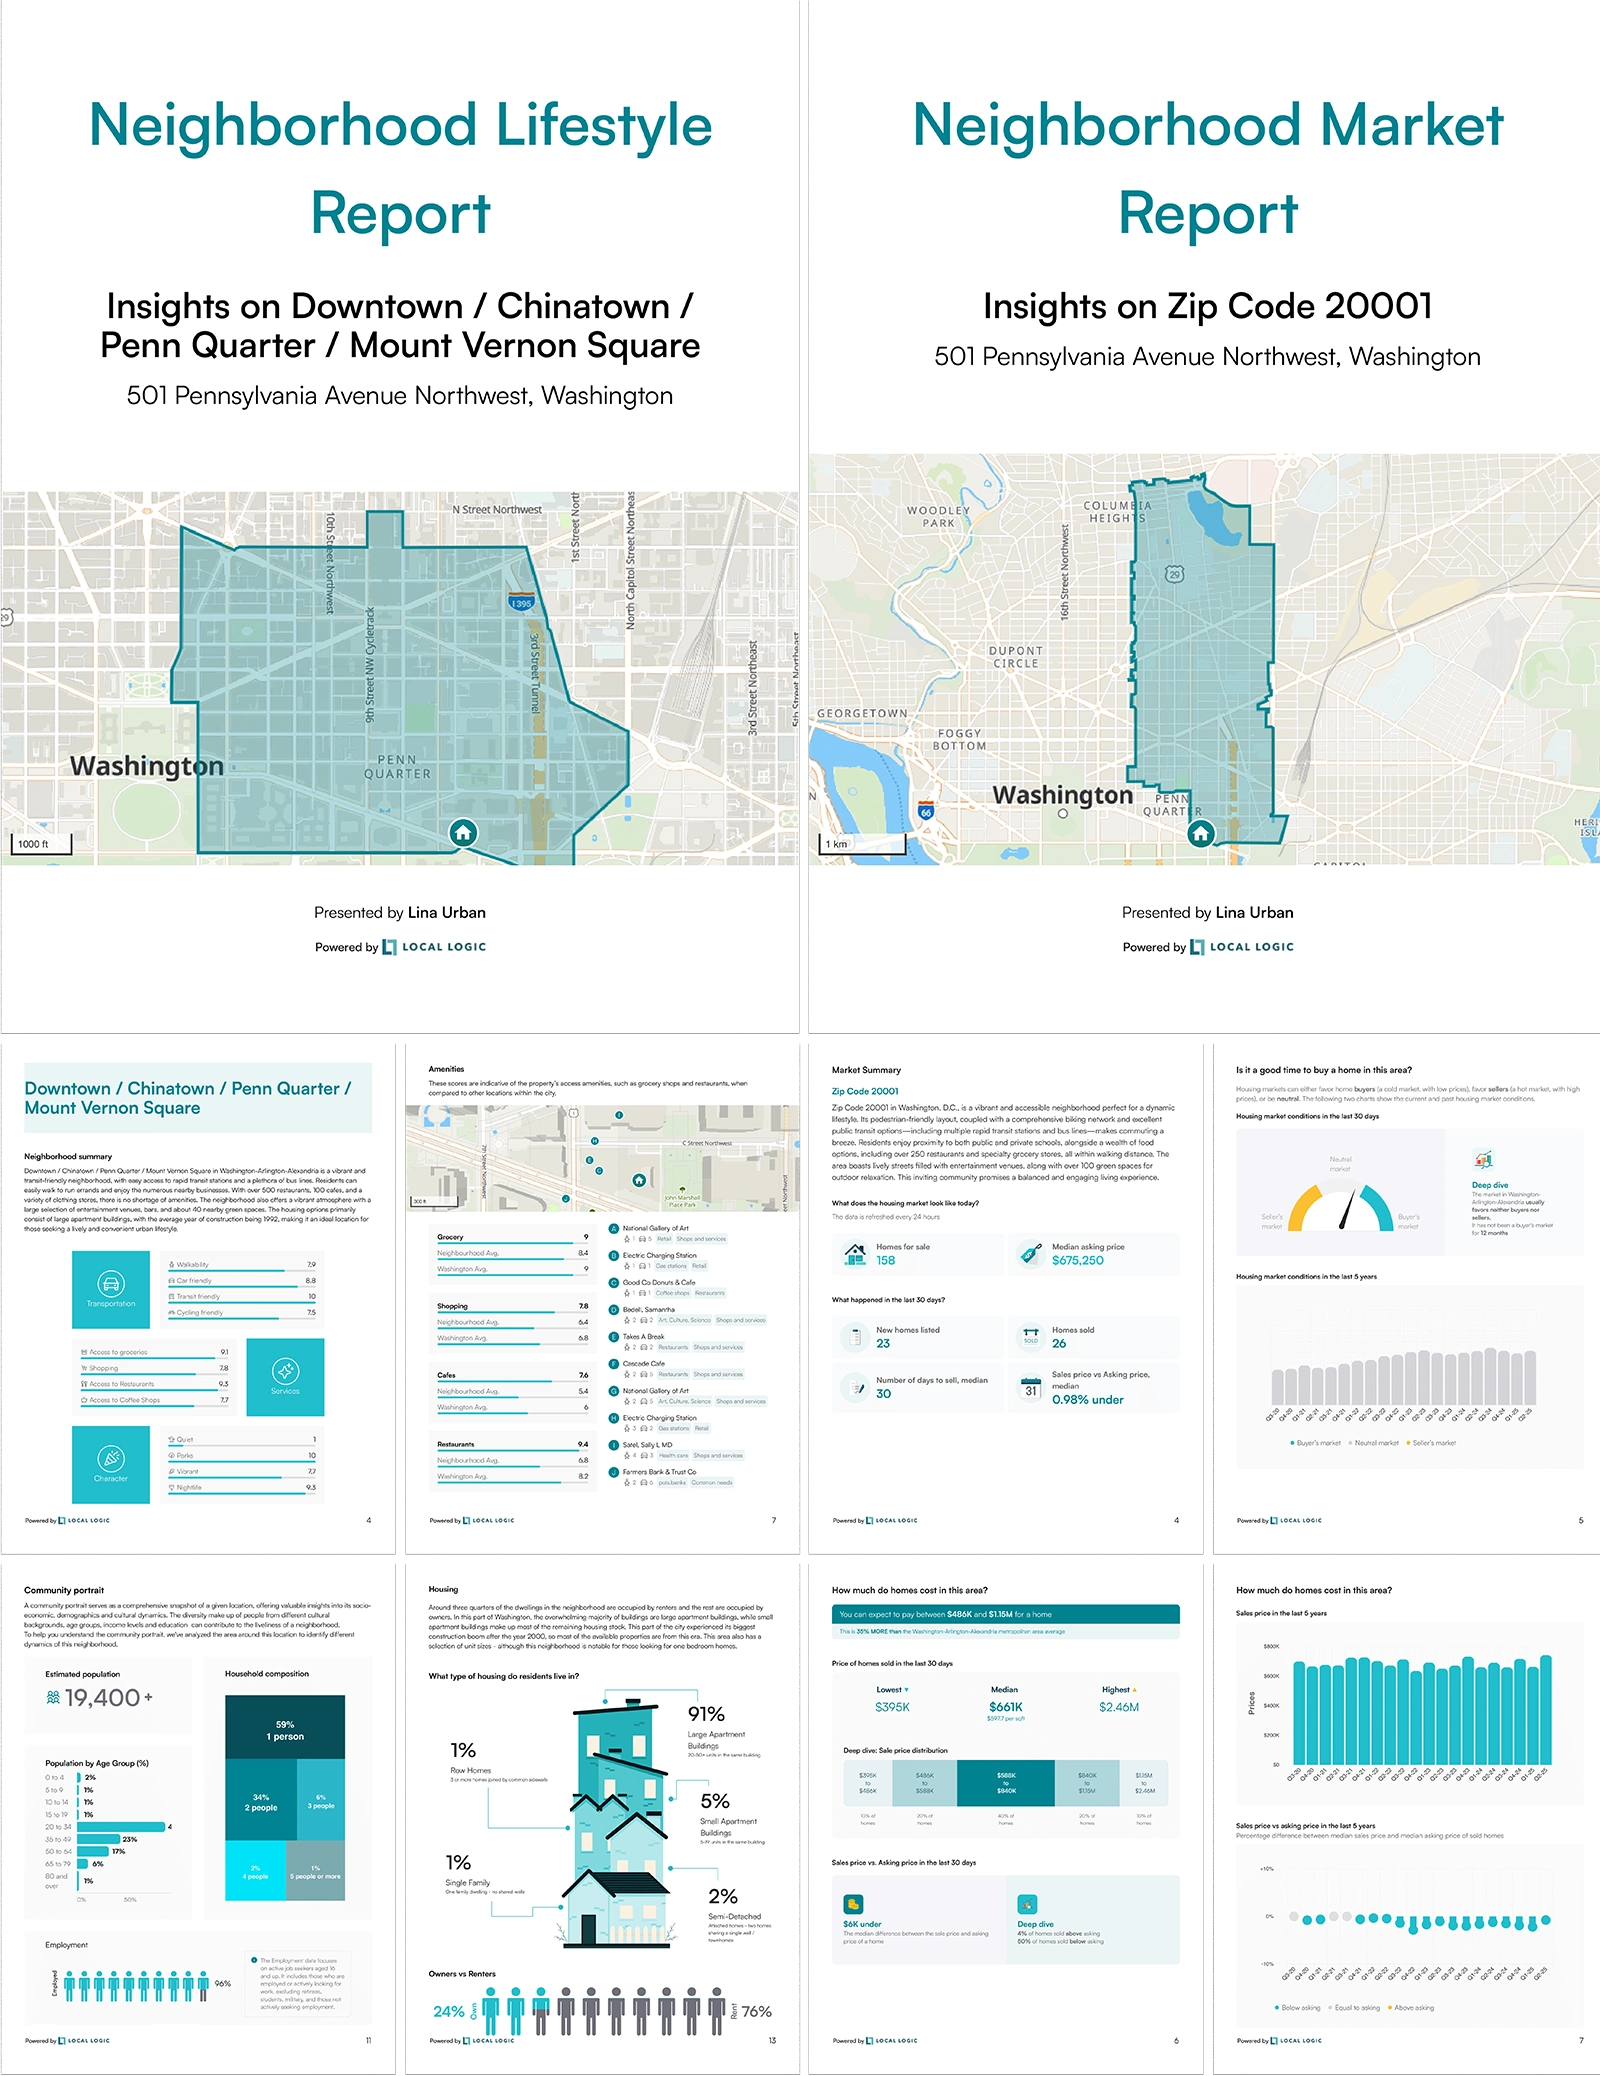
Local Logic is a location intelligence platform that provides detailed neighborhood and real estate market insights in an easy-to-read, visual format. It turns complex data into clear reports that help real estate professionals and their clients understand what it's like to live in a specific area, not just what homes cost there. At Oakley, Local Logic powers Neighborhood Lifestyle Reports and Neighborhood Market Reports that agents can share directly with clients.

What Local Logic Reports Include

These reports blend lifestyle insights with market data, giving you and your clients a complete understanding of the community. Key elements include:

Lifestyle & Neighborhood Context

  • Walkability & transit options
  • Amenities: grocery stores, parks, restaurants
  • Schools
  • Demographics
  • Climate
  • Points of Interest

Neighborhood Market Trends & Real Estate Metrics (U.S.)

  • Local market conditions
  • Price ranges of recently sold homes
  • List-to-sale price comparisons
  • Median prices
  • Days on market
  • Inventory levels
  • Year-over-year trends
  • Lifestyle factors that influence value

Easy to Use

Local Logic Reports are instantly accessible via QR code and optimized for both agents and homebuyers.

Local Logic Reports FAQ

What is the difference between Lifestyle and Market Reports?

  • Neighborhood Lifestyle Reports: Fast, visual reports showing transit options, lifestyle scores, schools, and more β€” helping buyers understand an area quickly.
  • Neighborhood Market Reports: Real estate pricing, trends, and market movement based on live and historical listing data.

What is the source of the data?

  • Neighborhood Lifestyle Reports: Powered by Local Logic's proprietary dataset of more than 100 billion data points, blending public sources, third-party data, and in-house models.
  • Neighborhood Market Reports: Pulled from live MLS feeds and historical market data.

Are Local Logic Reports mobile-friendly?

Yes, they are fully responsive on phones and tablets.

How are neighborhood boundaries defined?

Local Logic uses census data, municipal boundaries, zoning information, and local conventions.

Are rural areas supported?

Yes, with broad coverage across urban and rural regions in the U.S. and Canada. In remote areas, some datasets may have limited coverage.

How often is the data updated?

  • Lifestyle data: Updated on a rolling schedule depending on dataset type.
  • Market data: Refreshed daily based on MLS activity.

What problems do Local Logic Reports solve?

  • Telling the story of a neighborhood: No more collecting data manually β€” Local Logic centralizes everything instantly.
  • Positioning agents as local experts: Provide deep neighborhood knowledge, even outside your core areas.
  • Meeting modern buyer expectations: Consumers crave insights beyond listing details β€” Local Logic delivers them.
  • Increasing buyer confidence: Clear data supports faster decision-making and smoother transactions.

Local Logic Reports Examples

Image of ll reports overview